Buy Crypto
Markets
Spot
FuturesBTC
Earn
Event Center
Rewards Hub
More
How to Use the Volume Relative Strength Index (VRSI) in U.S. Stock Trading: A Complete Beginner's GuideHow to Use the Volume Relative Strength Index (VRSI) in U.S. Stock Trading: A Complete Beginner's Guide
Category List
Cancel

How to Use the Volume Relative Strength Index (VRSI) in U.S. Stock Trading: A Complete Beginner's Guide

Key Takeaways:

  • The Volume Relative Strength Index combines trading volume and price changes to measure buying and selling pressure, as well as market supply and demand.
  • VRSI uses 50 as the dividing line between market strength and weakness. Readings above 50 indicate a strong market, while readings below 50 indicate a weak market.
  • Changes in histogram height and color provide a visual indication of strengthening or weakening trend pressure.
  • VRSI can be applied to stocks, exchange-traded funds (ETFs), futures, forex, and cryptocurrencies.
  • Use VRSI alongside other price-based indicators and cross-check signals across multiple timeframes.

1. What Is the Volume Relative Strength Index?


The Volume Relative Strength Index (VRSI) is a volume-based technical indicator developed from the traditional Relative Strength Index (RSI). While traditional RSI is calculated solely from the magnitude of price gains and losses, VRSI incorporates trading volume into its core calculation. It uses four factors, namely the number of up days, the number of down days, the magnitude of volume increases, and the magnitude of volume decreases, to assess volume trends and anticipate supply and demand dynamics as well as buying and selling pressure.

2. How to Interpret the Volume Relative Strength Index


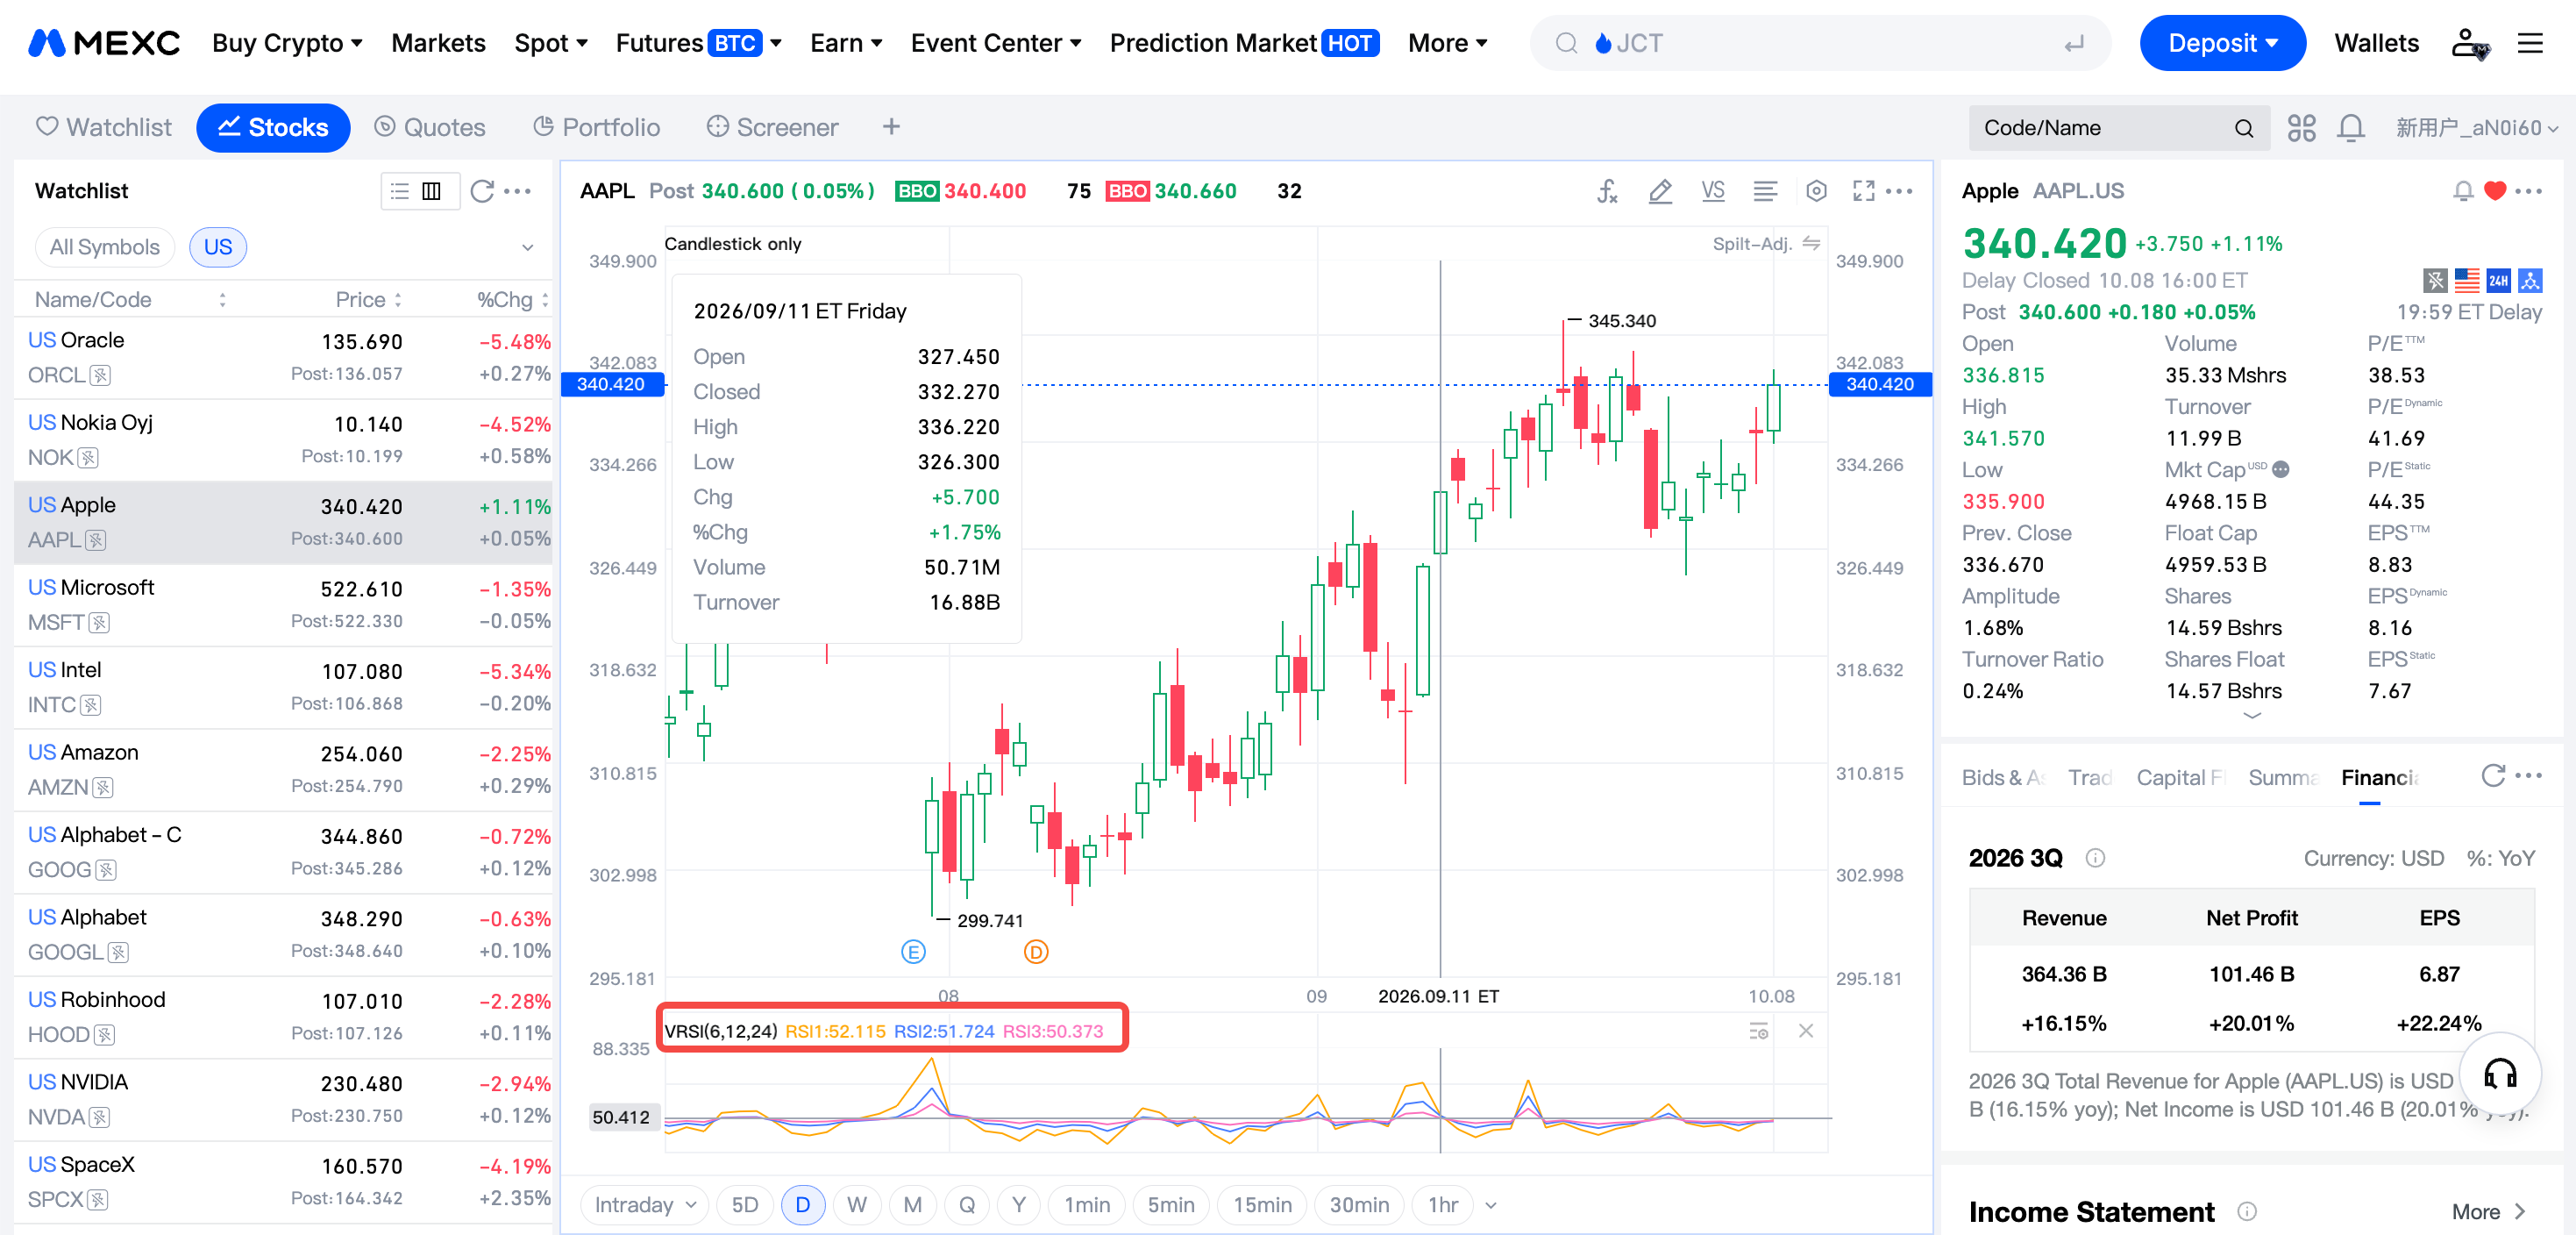
VRSI uses 50 as the dividing line between bullish and bearish conditions. Readings above 50 indicate a strong market, while readings below 50 indicate a weak market. Signals tend to be more accurate when the indicator is above 50. A crossover above this level often suggests that market sentiment is shifting from bearish to bullish, while a crossover below it suggests the opposite.


3. How to Use VRSI Buy and Sell Signals


1) Classic overbought and oversold signals: A downward turn above 60 is a sell signal, while an upward turn below 40 is a buy signal. Note that sell signals are generally more reliable than buy signals.

2) Comparing lows during consolidation: When the market is trading sideways, successively higher indicator lows suggest that buyers have the upper hand and prices may continue to rise. Successively lower lows, on the other hand, are a sell signal.

4. Key Considerations When Using VRSI


VRSI is a volume-based oscillator and should not be used as the sole basis for trading decisions. In practice, combine it with price-based indicators such as the Stochastic Oscillator and Moving Average Convergence Divergence (MACD) to assess price direction in the broader market context. It is also advisable to monitor the indicator across multiple timeframes, using longer timeframes to confirm direction and shorter timeframes to identify entry opportunities.

When trading on MEXC, you can use candlestick chart tools to combine volume analysis with price analysis. Set stop-loss orders consistently to manage risk on each trade.


5. Volume Relative Strength Index FAQ


5.1 What VRSI level indicates a buying opportunity?


Generally, an upward turn in VRSI below 40 is a buy signal, while a downward turn above 60 is a sell signal. However, these level-based signals should be assessed in the context of the overall trend rather than applied mechanically.

5.2 How does VRSI differ from traditional RSI?


Traditional RSI is calculated solely from price gains and losses. VRSI incorporates trading volume, weighting the strength of gains and losses by volume to better reflect actual capital participation.

5.3 Is there a better indicator than RSI?


No indicator is universally better than another, as each tool has a different focus. VRSI adds the volume dimension that traditional RSI lacks, but the best approach is to combine multiple indicators and validate signals across multiple timeframes.

5.4 What is the default VRSI setting?


A common default lookback period is 14. Short-term traders can shorten the period to increase sensitivity, while long-term investors can extend it to filter out market noise.

5.5 Which markets can VRSI be used in?


VRSI can be used in a range of markets, including stocks, ETFs, futures, forex, and cryptocurrencies. When trading digital assets on MEXC, you can also apply the indicator's analytical approach to assess the relationship between volume and price.

How to Use the Volume Relative Strength Index (VRSI) in U.S. Stock Trading: A Complete Beginner's Guide

Key Takeaways:

  • The Volume Relative Strength Index combines trading volume and price changes to measure buying and selling pressure, as well as market supply and demand.
  • VRSI uses 50 as the dividing line between market strength and weakness. Readings above 50 indicate a strong market, while readings below 50 indicate a weak market.
  • Changes in histogram height and color provide a visual indication of strengthening or weakening trend pressure.
  • VRSI can be applied to stocks, exchange-traded funds (ETFs), futures, forex, and cryptocurrencies.
  • Use VRSI alongside other price-based indicators and cross-check signals across multiple timeframes.

1. What Is the Volume Relative Strength Index?


The Volume Relative Strength Index (VRSI) is a volume-based technical indicator developed from the traditional Relative Strength Index (RSI). While traditional RSI is calculated solely from the magnitude of price gains and losses, VRSI incorporates trading volume into its core calculation. It uses four factors, namely the number of up days, the number of down days, the magnitude of volume increases, and the magnitude of volume decreases, to assess volume trends and anticipate supply and demand dynamics as well as buying and selling pressure.

2. How to Interpret the Volume Relative Strength Index


VRSI uses 50 as the dividing line between bullish and bearish conditions. Readings above 50 indicate a strong market, while readings below 50 indicate a weak market. Signals tend to be more accurate when the indicator is above 50. A crossover above this level often suggests that market sentiment is shifting from bearish to bullish, while a crossover below it suggests the opposite.


3. How to Use VRSI Buy and Sell Signals


1) Classic overbought and oversold signals: A downward turn above 60 is a sell signal, while an upward turn below 40 is a buy signal. Note that sell signals are generally more reliable than buy signals.

2) Comparing lows during consolidation: When the market is trading sideways, successively higher indicator lows suggest that buyers have the upper hand and prices may continue to rise. Successively lower lows, on the other hand, are a sell signal.

4. Key Considerations When Using VRSI


VRSI is a volume-based oscillator and should not be used as the sole basis for trading decisions. In practice, combine it with price-based indicators such as the Stochastic Oscillator and Moving Average Convergence Divergence (MACD) to assess price direction in the broader market context. It is also advisable to monitor the indicator across multiple timeframes, using longer timeframes to confirm direction and shorter timeframes to identify entry opportunities.

When trading on MEXC, you can use candlestick chart tools to combine volume analysis with price analysis. Set stop-loss orders consistently to manage risk on each trade.


5. Volume Relative Strength Index FAQ


5.1 What VRSI level indicates a buying opportunity?


Generally, an upward turn in VRSI below 40 is a buy signal, while a downward turn above 60 is a sell signal. However, these level-based signals should be assessed in the context of the overall trend rather than applied mechanically.

5.2 How does VRSI differ from traditional RSI?


Traditional RSI is calculated solely from price gains and losses. VRSI incorporates trading volume, weighting the strength of gains and losses by volume to better reflect actual capital participation.

5.3 Is there a better indicator than RSI?


No indicator is universally better than another, as each tool has a different focus. VRSI adds the volume dimension that traditional RSI lacks, but the best approach is to combine multiple indicators and validate signals across multiple timeframes.

5.4 What is the default VRSI setting?


A common default lookback period is 14. Short-term traders can shorten the period to increase sensitivity, while long-term investors can extend it to filter out market noise.

5.5 Which markets can VRSI be used in?


VRSI can be used in a range of markets, including stocks, ETFs, futures, forex, and cryptocurrencies. When trading digital assets on MEXC, you can also apply the indicator's analytical approach to assess the relationship between volume and price.