Bitcoin Liquidation Map Shows $65,000 Support and $68,000 Squeeze Zone
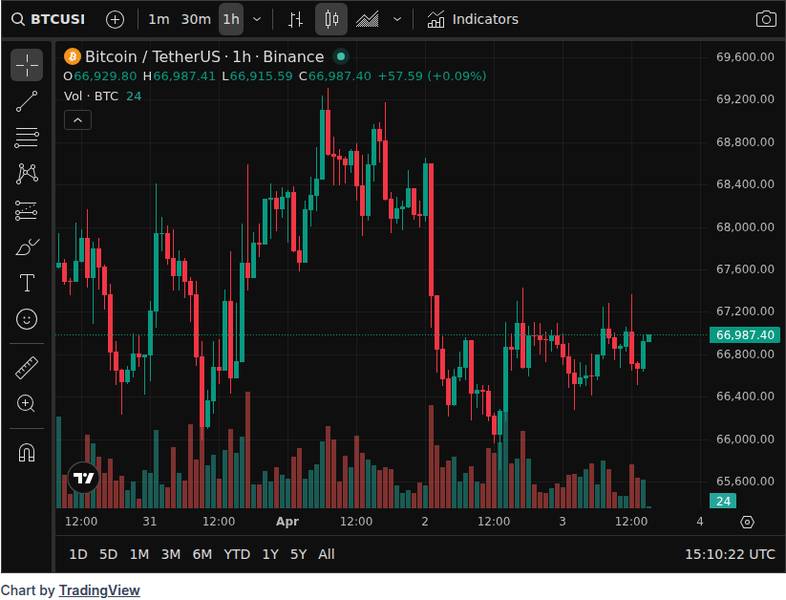
Bitcoin’s liquidation map is highlighting $65,000 as a key support zone and $68,000 as a potential squeeze trigger, with BTC trading near $66,944 amid extreme fear in the market and $33.3 million in liquidations over the past 24 hours.
The cryptocurrency’s spot price sat at $66,944 with a modest 0.24% gain over 24 hours, a market cap of roughly $1.34 trillion, and daily trading volume near $33.2 billion. The Fear & Greed Index has plunged to 9, classified as Extreme Fear, reflecting broad defensive positioning across the derivatives market.
 CoinGecko market snapshot used to anchor the spot-price section for bitcoin.
Why the Bitcoin liquidation map puts $65,000 in focus
Liquidation maps track where leveraged positions are concentrated across exchanges, revealing price levels where forced closures could accelerate moves. The CoinGlass Bitcoin liquidation map has flagged $65,000 as a zone with dense long-position clusters, meaning a drop to that level could trigger cascading liquidations and amplified selling pressure.
With BTC currently trading roughly $2,000 above that threshold, the level acts as a line of defense. If buyers absorb selling near $65,000, it reinforces the floor. If the level breaks, forced long liquidations could drag price toward the lower end of the broader range.
That broader range has been well-documented. A Glassnode on-chain report noted Bitcoin has consolidated within a $62,800 to $72,600 band for over a month, with repeated failures to establish footing above $70,000. The $65,000 support sits comfortably inside that range, making it a near-term pivot rather than a macro bottom.
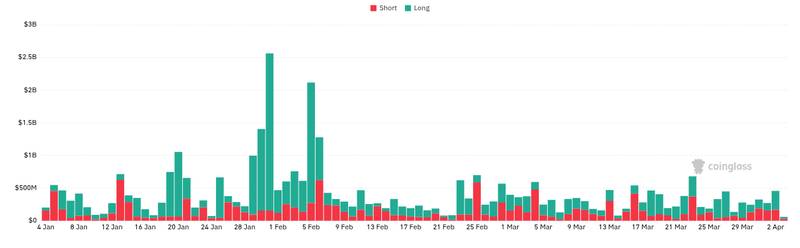
Over the past 24 hours, Coinalyze data showed $18.1 million in long liquidations against $15.2 million in shorts, for a combined $33.3 million. The slight skew toward longs suggests bearish pressure has been modestly dominant, consistent with the Extreme Fear reading and the defensive tone around weekend trading dynamics heading into the new quarter.
 CoinGlass derivatives data capture supporting the futures-and-liquidations angle for bitcoin.
What makes $68,000 a squeeze zone for BTC
While $65,000 anchors the downside, $68,000 is where upside risk concentrates. A squeeze zone differs from simple resistance: it marks a level where short positions are clustered so densely that a push through it forces rapid buybacks, creating a self-reinforcing rally.
Glassnode’s report supports this framing. Perpetual futures funding rates have turned negative, meaning short positioning has grown materially. If spot demand continues to recover, a short squeeze could develop as those positions get forcibly closed, particularly around densely leveraged price bands like $68,000.
A TradingView report syndicated from Coinpedia described BTC defending a $67,000 to $68,000 support region while heavy upside liquidity sits above $70,000 to $72,000. That layered structure means a move through $68,000 would not just clear immediate shorts but could open a path toward the upper boundary of the month-long consolidation range.
The mechanics matter for context: forced short liquidations inject buying volume that the market must absorb. In thin liquidity conditions, common during periods of extreme fear, even modest buying can trigger outsized moves. The current environment, where institutional custody frameworks are still developing and macro uncertainty persists, creates exactly the type of low-liquidity backdrop where squeezes gain traction.
How traders may read the range between $65,000 and $68,000
The $3,000 band between $65,000 and $68,000 forms a decision zone. A sustained hold above $65,000 with a push through $68,000 would confirm short-squeeze momentum and bring the $70,000 to $72,600 upper range back into play. A breakdown below $65,000, by contrast, would invalidate the support thesis and expose BTC to the $62,800 floor Glassnode identified.
One important caveat: according to the original headline source, the live liquidation map specifically flags these two levels as the key thresholds. However, the exact cluster values on CoinGlass’s live map could not be independently extracted during research, and supporting coverage points more clearly to support around $67,000 to $68,000 with squeeze risk in the $70,000 to $72,000 area.
The negative funding environment adds a directional bias worth watching. When shorts are crowded and funding is negative, even sideways price action slowly bleeds short holders through funding payments. That pressure can eventually force position closures without a dramatic catalyst, as discussions around blockchain’s role in modernizing financial infrastructure continue to shape longer-term sentiment.
U.S. spot Bitcoin ETF flows have recently turned modestly positive after a stretch of outflows, according to Glassnode, providing a potential demand floor beneath the derivatives volatility. Whether that bid is strong enough to push BTC through the squeeze zone or merely slow a grind toward $65,000 will likely be determined by how aggressively leveraged positions unwind in the sessions ahead.
Disclaimer: This article is for informational purposes only and does not constitute financial or investment advice. Cryptocurrency and digital asset markets carry significant risk. Always do your own research before making decisions.


Ayrıca Şunları da Beğenebilirsiniz

XRP Coil Nears Snap While Breakdown Confirms Bearish Momentum

Trump biographer predicts next 3 Cabinet members on the chopping block