Shiba Inu today: 1H RSI at 27 warns of a reflex bounce that sellers may fade
In a risk-off crypto tape, liquidity is rotating to majors, and Shiba Inu today faces a classic oversold-bounce-or-fail setup.
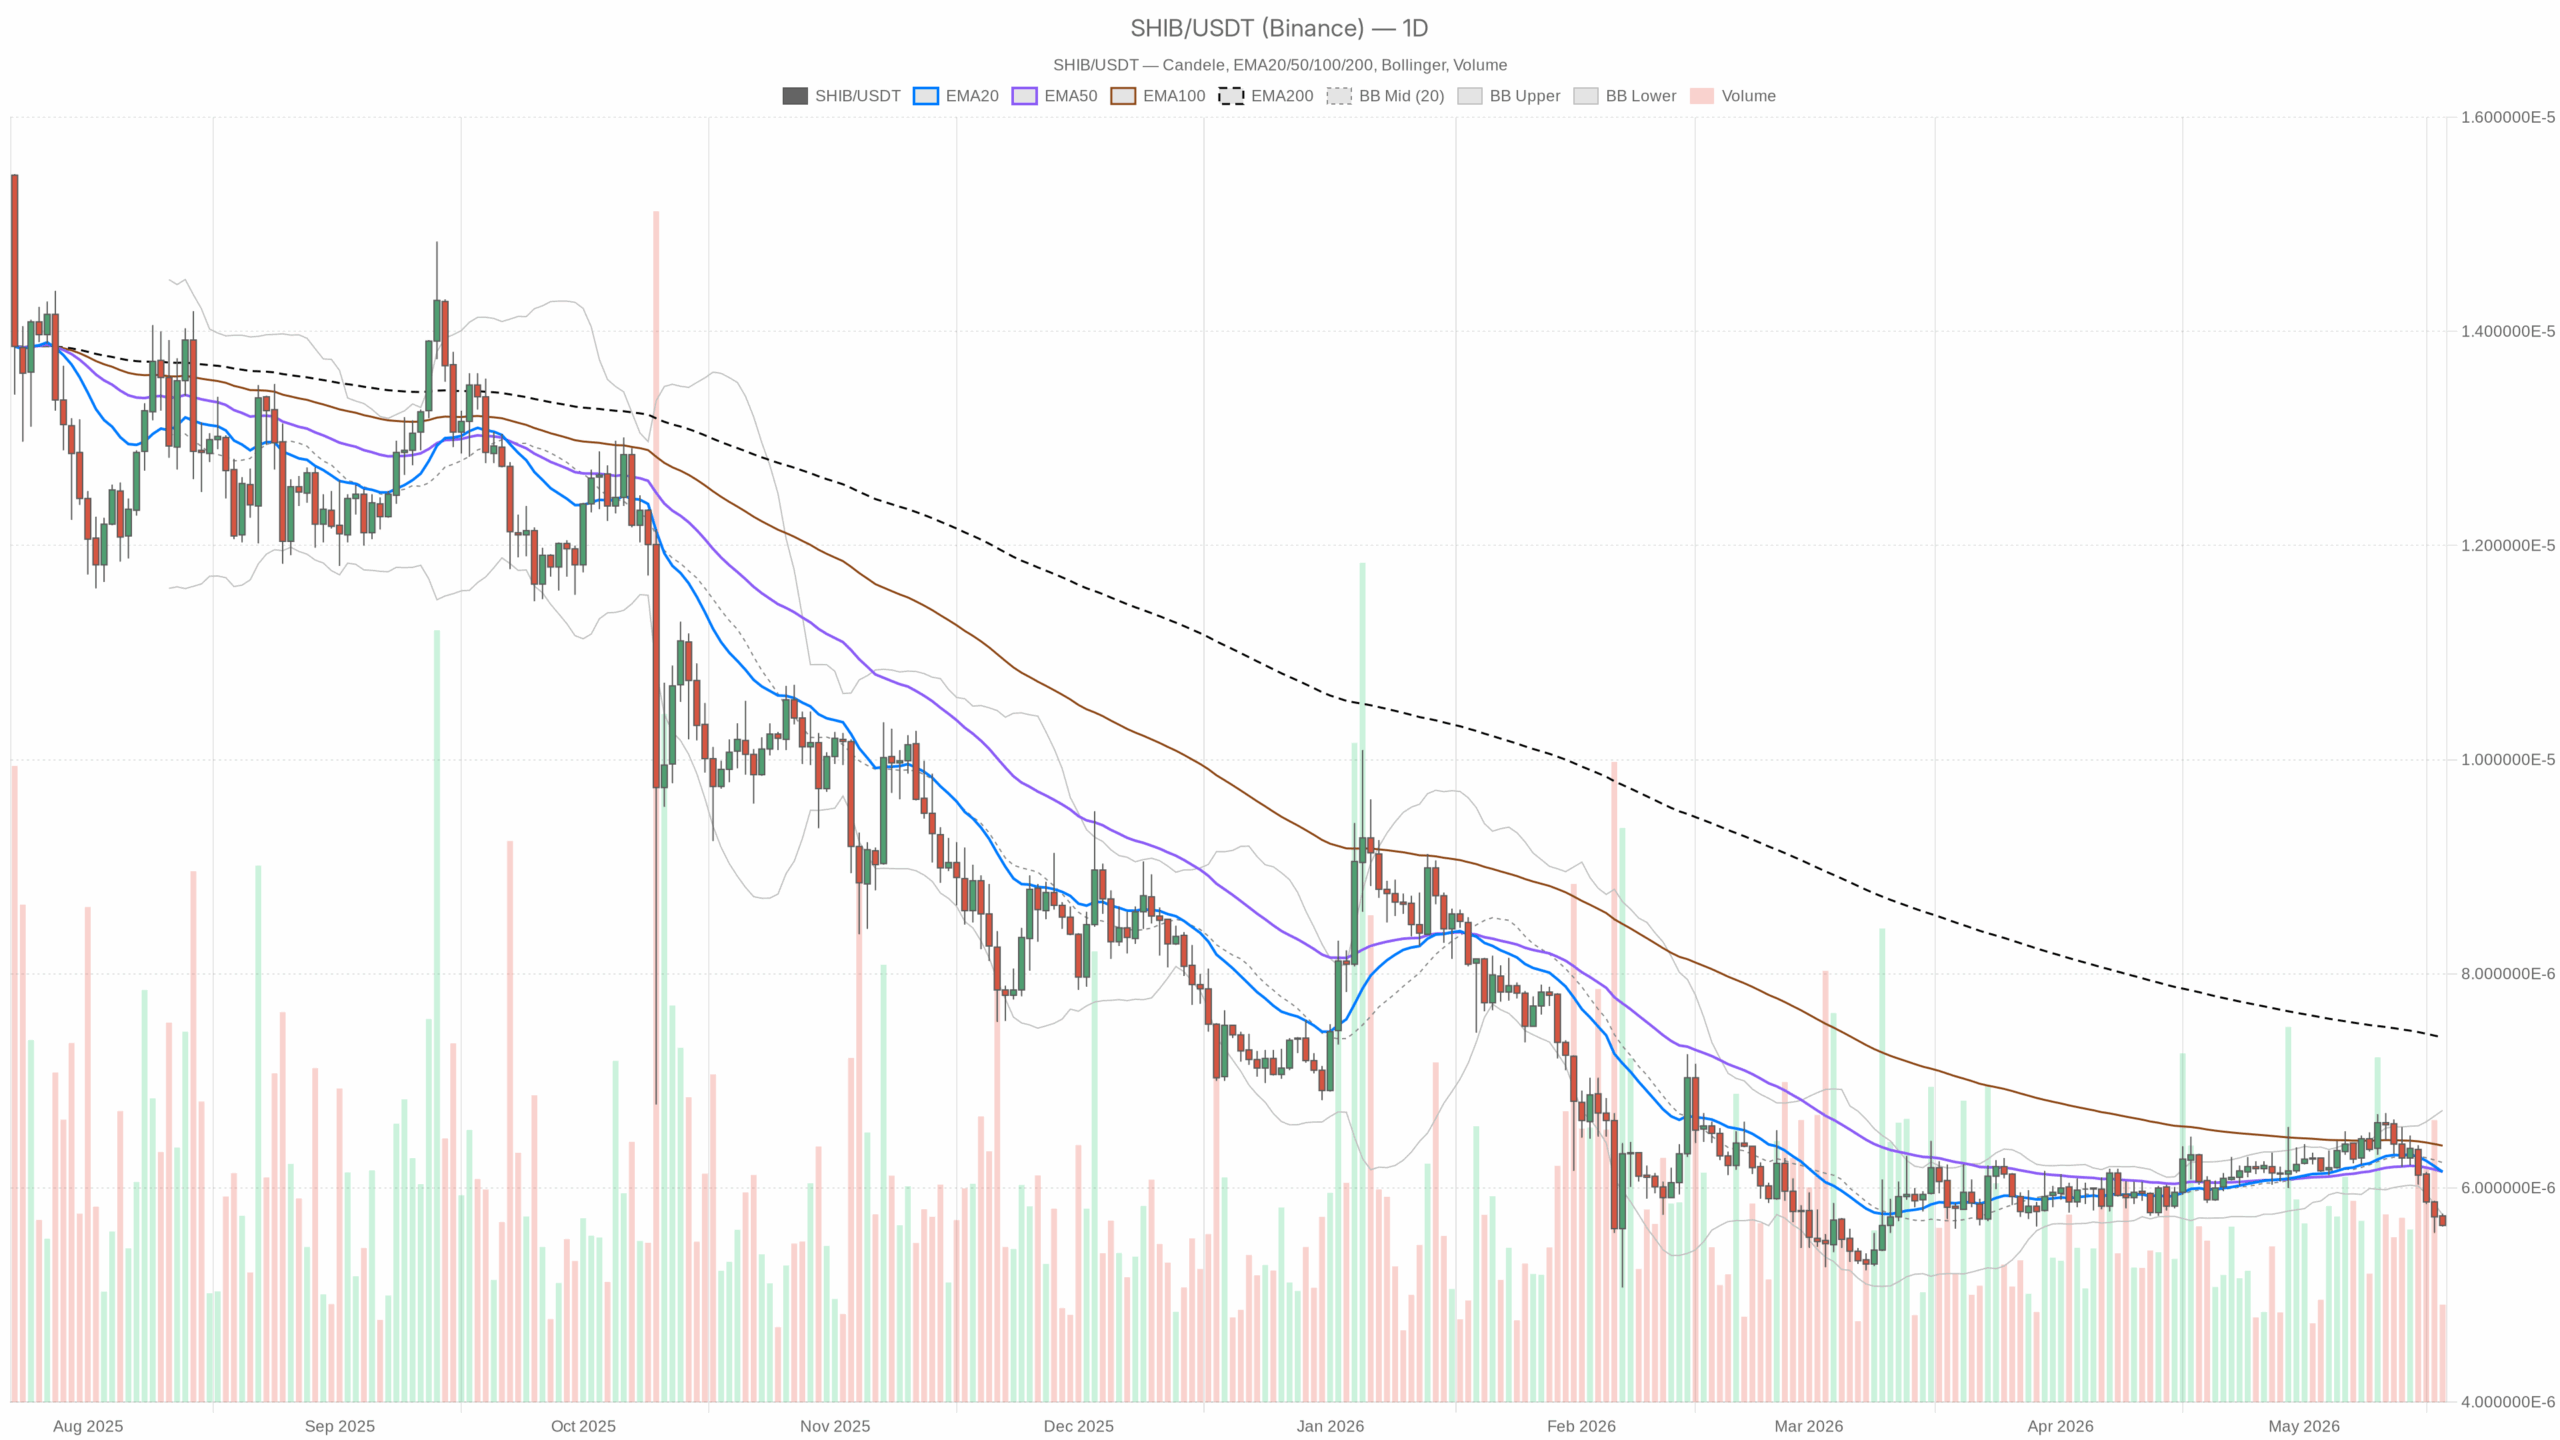 SHIB/USDT — daily chart with candlesticks, EMA20/EMA50 and volume.
Thesis — Shiba Inu outlook today
Shiba Inu (SHIB) is trading into a risk-off crypto backdrop. As of 18 May 2026, BTC dominance sits near 58% while total market cap is down about 1.5% over 24 hours. The Fear & Greed Index prints 28 (Fear). In this tape, liquidity concentrates in BTC and stables, starving alt beta.
On the chart, the daily regime is bearish. However, momentum is weak, but intraday is stretched enough to tempt a reflex pop. This moment matters because either we get a standard bear-market bounce that sellers fade into, or we see continuation lower if those bounces fail quickly.
Market logic
Daily defines the bias: downtrend intact. However, the one-hour shows momentum exhaustion but not yet a reversal. The fifteen-minute is for timing only—early signs of basing are there, but they need confirmation from the 1H to matter. That said, trends still trump mean reversion until the 1H structure turns.
Multi-timeframe read
Daily (macro bias): Bearish regime with RSI at 34.21. That is bear-market territory—weak but not fully washed out—leaving room for another leg lower unless demand steps in.
1H (confirmation or conflict): RSI at 27.29. Deeply oversold, which often fuels a sharp countertrend bounce, but in risk-off conditions oversold can persist. Bulls need higher lows and a reclaim of intraday control areas to flip the script.
15m (execution context): RSI at 34.66. Attempting to stabilize, useful for entries and exits, but it means little unless the 1H builds a base.
Indicators as evidence
RSI (D1/H1/M15): 34.21 / 27.29 / 34.66. Bears own the daily trend, intraday is stretched, and the micro time frame is trying to base. Overall, risk of a pop remains, but the higher-timeframe downtrend still calls the shots for Shiba Inu today.
MACD: Momentum skews south on higher timeframes in line with the bearish regime. For any bounce to have legs, watch for the 1H momentum to turn up and hold; without that, rallies are likely sold.
EMAs: In a bearish regime, short- and mid-term EMAs tend to sit overhead as dynamic resistance. A clean 1H close back above the short EMA and holding it on a retest would be the first real tell that mean reversion is gaining traction.
Bollinger Bands: Intraday behavior is consistent with riding the lower band. If price can close back inside and tag the mid-band on the 1H, you have a textbook bounce setup; repeated rejections keep the trend intact.
ATR / Volatility: Expect wider intraday ranges and jumpy tape—typical when markets are fearful and momentum is stretched. Moreover, position sizing and trade location matter more than usual.
Pivots: Treat the daily pivot region as first supply on bounces. Acceptance above it would open room toward the next resistance band; failure there argues for continued grind toward lower supports.
Scenarios
Bullish (mean reversion): 1H prints a higher low, RSI recovers through 40–45, and price reclaims the intraday short EMA and daily pivot with follow-through. That unlocks a squeeze into overhead resistance clusters. Invalidation: fresh daily low with 1H RSI pinned sub-35 and repeated rejections at intraday midlines.
Bearish (trend continuation): Early bounces fail at EMA and pivot resistance, 1H RSI stays depressed. And the daily RSI holds in the low 30s while the broader market remains risk-off (high BTC dominance, weak total mcap). That keeps the path open for lower lows. Invalidation: strong 1H reclaim above intraday resistance that converts into support, followed by a constructive daily close that lifts RSI away from the bear zone.
Positioning, risk, and uncertainty
This is a seller’s tape until the 1H structure turns. As such, if you are hunting longs, you want confirmation—reclaims that hold and momentum that does not immediately fade. If you are leaning short, the better entries are on failed rallies into known supply, not at extremes after long pushes. Expect elevated volatility, headline sensitivity, and patchy liquidity—especially in meme coin land. Size smaller, respect invalidation, and avoid marrying intraday bias when the higher timeframe is still in control.
In sum, the bias remains down while intraday conditions invite a reflex bounce; confirmation on 1H will decide if mean reversion sticks or trend resumes.


Ayrıca Şunları da Beğenebilirsiniz

Standard Chartered moves to acquire Zodia Custody, integrating crypto services

Trillion-Dollar Italian Bank Moves To XRP, But How Much Have They Bought?