

Gold Price Prediction for Next Week: “Bullish Candle Expected” – Analyst Warns Sellers Will Be Trapped
Gold price has been in a pretty brutal downtrend. From January highs above $5,600, the metal has fallen over 25% to current levels around $4,155. Most traders expect further downside toward the psychological $4,000 level. But analyst Itsadiee_Fx sees a different story. He warns that market makers have set a strong trap for sellers. He expects a bullish weekly candle next week instead of the continued drop that most are predicting.
Let’s explain his detailed analysis, his chart, and whether this gold price prediction is realistic.
Itsadiee_Fx’s Take: The Trap Is Set
The analyst starts with a bold warning: “If you trade gold next week without seeing this, you’re taking a big risk.” He explains that the market is currently appearing highly bearish to most traders. Last week, after the breakdown below $4,100, many traders expected the reversal to continue to the upside.
Those expectations failed, and buyers were heavily liquidated. Because of the strong downside move, a large portion of traders have now shifted their bias toward selling. As a result, many will prefer selling on pullbacks next week, targeting the key psychological level of $4,000.
But the real question is: will the market actually allow sellers to achieve this so easily? The analyst does not think so.
He points to last week’s action. After sweeping liquidity around $4,366, the market showed a sharp rejection from around $4,383. This area is important because it has already acted as resistance before. On October 17, 2025, the market formed a high around $4,380, and from that level we saw a major drop of nearly 11.30%.
Last week, during FOMC, the market again rejected from this same zone, which has increased seller confidence.
However, there is a key shift. From a broader perspective, the market has been consistently making lower lows over the past few weeks. But last week did not sweep the previous week’s low and instead closed on the upside. This shift is important, and because of that, he is expecting a bullish weekly candle next week.
The Technical Setup: Why Sellers Could Be Trapped
Now comes the critical technical observation. On the daily timeframe, the June 11 candle – a liquidity sweep candle – is very strong. Based on his experience, such strong candles are rarely broken directly. Most of the time, the market first focuses on liquidity generation – creating traps and building positions – and only after that does it break down or move beyond such strong candles.
 Source: X/@Itsadiee1
This supports the idea that the market may not move directly toward $4,000. Instead, it will spend time trapping traders before the actual move. Since the market has been falling continuously, sentiment has turned strongly bearish. Most traders are now expecting a direct move toward $4,000. But this is a major psychological level, and the market usually does not allow such obvious targets to be achieved easily.
For the analyst, the $4,136 – $4,084 zone is a very important support area. As long as gold is trading above this zone, he is not interested in selling. Instead, he expects the market to show small pullbacks to attract sellers, and then gradually move higher.
From a higher timeframe perspective as well, this zone is strong. Until we see a strong 1-hour candle closing below it with volume, selling remains risky – especially after such an extended downside move.
He also notes that many traders who sold from the $4,380 zone are likely holding positions and targeting lower levels. However, he expects that the market may break above $4,383 (last week’s high), especially because it is very close to $4,400, where many traders typically place their stop losses.
Read also: Kiyosaki Predicts $35,000 Gold by 2035
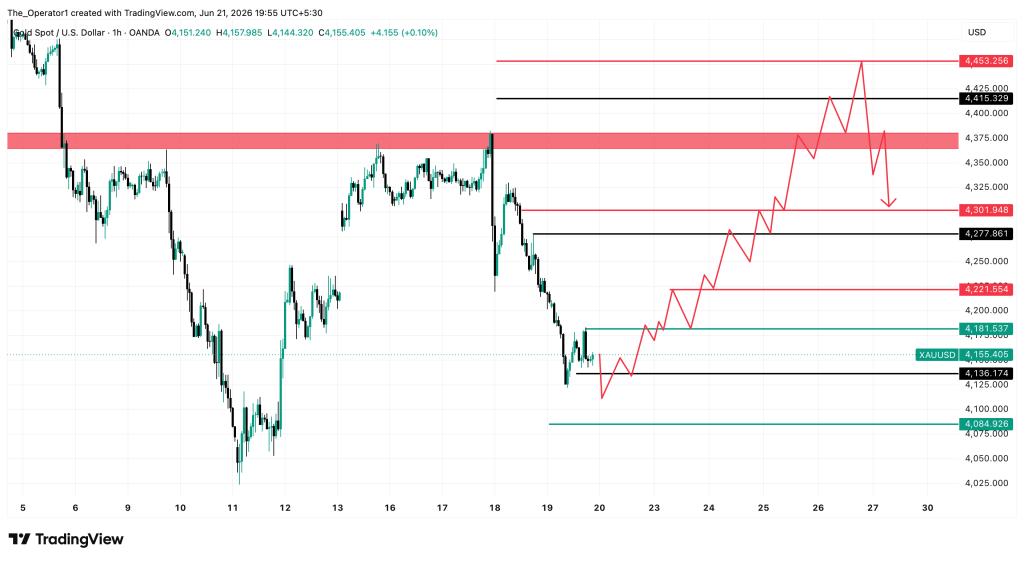
Gold Chart Analysis (1-Hour Gold)
The attached 1-hour chart from TradingView shows gold’s recent price action from June 10 to June 21, 2026. Key observations:
Price action: Gold has been in a clear downtrend, making lower highs and lower lows. The price dropped from around $4,453 to current levels near $4,155. However, the decline has slowed, and the most recent candles show consolidation around the $4,150 area.
Key levels: The chart shows several important levels. The $4,301‑$4,325 area acted as resistance earlier in the move. The $4,200‑$4,221 zone is a mid-level. The $4,181 area was support before breaking. The current critical support zone is marked between $4,136 and $4,084. Below that, $4,025 and $4,000 are the next targets for bears.
The liquidity sweep: The June 11 candle is not visible on this 1-hour chart (it’s a daily candle), but its effect is still present in the structure. The analyst noted that such strong candles are rarely broken directly – a valid observation from market experience.
Rejection zone: The $4,383 area is clearly marked as resistance. This level rejected price on October 17, 2025, and again during FOMC last week. If gold can reclaim this level, it would be a significant bullish signal.
Support zone: The $4,136‑$4,084 zone is the most important area on the chart. As long as gold holds above this zone, the bullish case remains intact. A break below would open the door to $4,000.
Our Opinion: Is This Gold Price Prediction Realistic?
Itsadiee_Fx’s gold price analysis is detailed, coherent, and grounded in solid technical principles. The idea that market makers trap traders before significant moves is widely observed in markets. The fact that most traders are now bearish and targeting $4,000 is exactly the kind of crowd sentiment that often precedes a reversal.
The $4,084‑$4,136 support zone is a logical area for a bounce. It is a confluence of previous support, a psychological level, and the lower end of the recent range. If gold holds this area, a move back toward $4,383 is plausible. A break above $4,383 would open the door to $4,400 and potentially higher.
However, the macro backdrop is still challenging. The Fed remains hawkish, the dollar is strong, and geopolitical tensions are easing. These factors could continue to pressure gold. A bullish weekly candle next week is possible, but it would require a shift in sentiment – either weaker economic data or a dovish Fed signal.
Overall, the prediction is realistic for a short-term bounce. The risk-reward favors the upside if $4,084 holds. But traders should be prepared for volatility and use tight stops. The analyst’s warning about the trap is worth heeding.
Subscribe to our YouTube channel for daily crypto updates, market insights, and expert analysis.
The post Gold Price Prediction for Next Week: “Bullish Candle Expected” – Analyst Warns Sellers Will Be Trapped appeared first on CaptainAltcoin.


Ayrıca Şunları da Beğenebilirsiniz

Michael Saylor Sparks Fresh Bitcoin Buy Speculation With Cryptic Message

Japanese Tech Giant’s Ambitious Bitcoin Accumulation

Ken Griffin fires back at Mamdani, says business leaders must 'fight for their city'


Popüler Haberler
Daha fazla
