-
Bitcoin’s current price structure closely resembles its 2022 capitulation phase, raising the possibility of one final major correction.
-
A short-term rebound toward $64,000–$65,000 could come first for the Bitcon, but rejection there may push the price below $50,000.
Bitcoin (BTC) price is facing fresh selling pressure after slipping below the key $60,000 support, adding more weight to the ongoing bearish trend. The price is down slightly by 1.05% to $58,363 in the past 24 hours, underperforming merely the weaker broader market trend. The latest breakdown has pushed the market into a weaker structure, with lower highs continuing to form and sell-side pressure increasing. While this may look like another leg down, it could also signal that Bitcoin is entering the final phase of its broader bear cycle, a stage often marked by panic selling and heavy liquidations before a reversal begins.
However, if the current weakness continues and buyers fail to step in, BTC could still see another sharp correction of nearly 25% before finding a stronger bottom. For traders, the focus now shifts to whether this is the final capitulation or just the start of a deeper move lower.
Why is the Bitcoin (BTC) Price Falling Today?
The Bitcoin price is facing fresh downside pressure after breaking below the key $60,000 support zone, triggering a wave of selling across both spot and derivatives markets. The latest decline appears to be driven by a mix of multiple reasons, all of which have added pressure on Bitcoin’s short-term trend. Here are the key reasons behind today’s drop:
- Breakdown below $60,000 triggered over $320 million in long liquidations: The loss of the $60K support acted as the immediate trigger, forcing leveraged long positions out of the market and accelerating downside momentum.
- Spot Bitcoin ETFs recorded over $180 million in net outflows in the last 24 hours: Persistent ETF selling continues to weaken institutional demand, reducing the market’s ability to absorb fresh supply.
- BlackRock reportedly sold over $200 million worth of BTC: This added extra sell-side pressure and strengthened bearish sentiment across the market.
- Citigroup cut its Bitcoin target from $112,000 to $82,000: The downgrade also came with reduced ETF inflow expectations, further hurting institutional confidence.
- Bitcoin open interest dropped from $34.8 billion to $32.9 billion: This nearly $2 billion decline signals aggressive leverage unwinding as traders reduce risk exposure.
- Funding rates turned neutral after staying elevated for weeks: This suggests bullish conviction is fading, with traders no longer willing to aggressively pay for long exposure.
- Market structure remains weak with lower highs intact: BTC has failed to reclaim its recent resistance near $63,500, keeping the broader bearish structure intact and increasing the risk of a deeper move toward the $53,000–$54,000 liquidity zone.
Why Bitcoin (BTC) Price Could See a 25% Pullback Before the Next Bullish Move
Bitcoin’s current market structure is beginning to resemble a setup last seen during the 2022 bear market, when a combination of weakening momentum and moving average breakdowns triggered a deeper correction before the market eventually stabilized.
Back then, the 50-week moving average crossed below the 100-week MA, creating a bearish crossover that signaled trend weakness. Around the same time, Bitcoin’s RSI slipped into oversold territory, while the price lost its 200-week moving average support—a combination that led to a nearly 26% correction before finding a bottom.
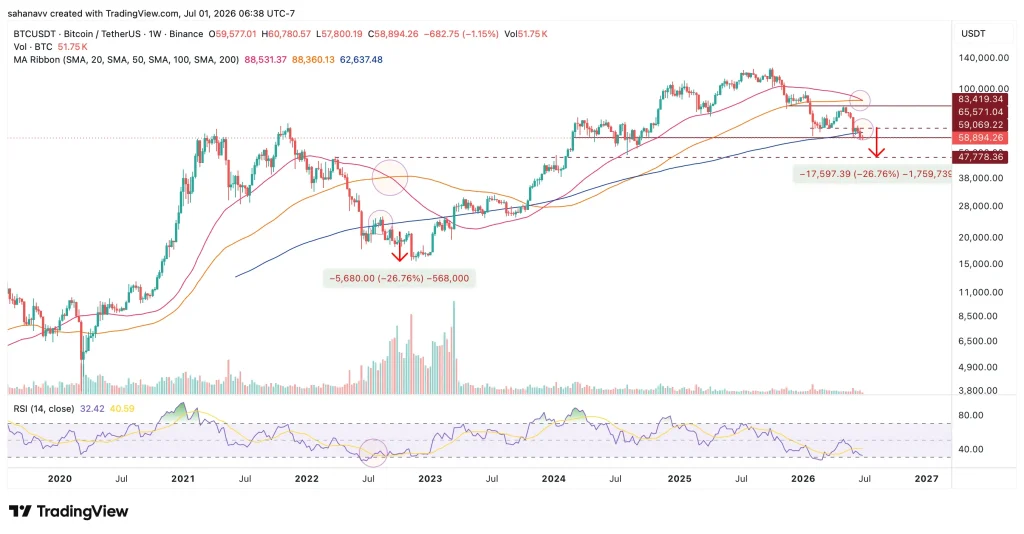
The current setup is starting to show similar characteristics. Once again, the 50-week MA is on the verge of crossing below the 100-week MA, while the RSI has dropped to 32, hovering close to historically weak momentum levels. More importantly, Bitcoin is now trading below its 200-week MA near $62,600, which is often seen as a major long-term trend support.
However, one key difference this time is that the price may not collapse immediately. The chart suggests Bitcoin could first attempt a short-term recovery toward the $64,000–$65,500 range, where it may retest the broken support and moving average cluster. If that zone fails to flip back into support, it could act as a rejection point.
Is Bitcoin (BTC) Price Near Its Final Bear Market Bottom?
Bitcoin’s structure is showing clear similarities to its late-bear phase in 2022, where a bearish 50/100 MA crossover, weak RSI, and a breakdown below the 200-week MA led to a 26% correction before the market bottomed. The current setup reflects the same pattern, with BTC now trading below its 200-week MA at $62,600 and the RSI slipping to 32, signaling persistent weakness.
In the short term, Bitcoin (BTC) price could still see a relief bounce toward $64,000–$65,000, but unless bulls reclaim that range and turn it into support, the risk of another 25% downside move toward $47,000–$50,000 remains high. That zone could act as the final capitulation area before the next major bullish reversal begins.