

Will Cardano Ever Recover? ADA Price Chart Looks ‘Dead’, But…
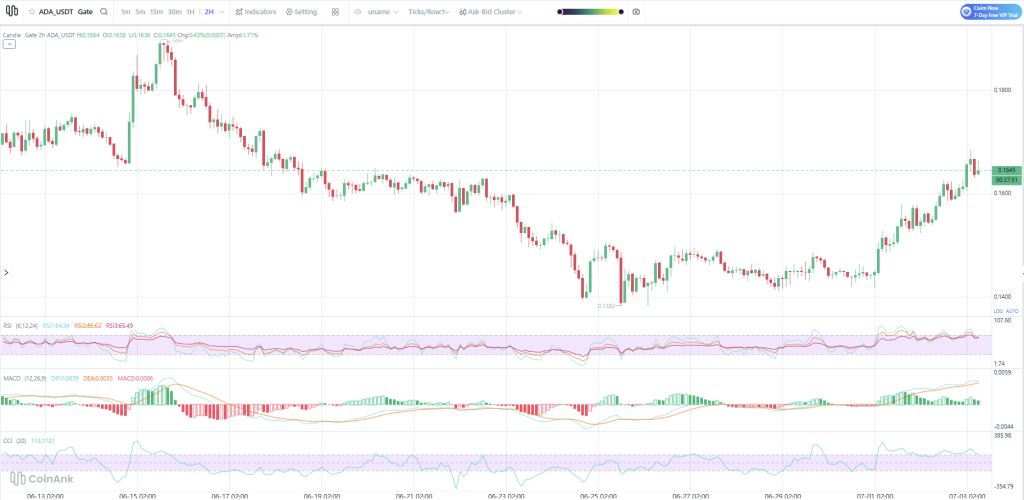
Cardano price pumped 6% during the ongoing crypto market recovery and is back above $0.16 for the first time in around two weeks. The token now trades near $0.165, up from the recent low near $0.138.
There are a lot of questions floating around the crypto community, mainly related to: Is Cardano dead? Will Cardano ever recover?
I decided to have a detailed look at the ADA chart today.
Cardano Chart Analysis: Four Phases of Price Action
Phase 1 (Mid-June): Blow-off Rally
ADA rallied sharply from around $0.17 to nearly $0.19. Buyers exhausted themselves quickly. The long upper wick and immediate selling indicate a distribution event, not healthy accumulation. This was the last gasp of the bulls before the real pain began.
Phase 2 (June 16–25): Persistent Downtrend
Price then produced lower highs, lower lows, weak bounces, and declining momentum. This is a textbook bearish trend. Every rally was sold. The trend finally bottomed around $0.138–$0.140, which became an important swing low.
Phase 3 (June 25–July 1): Base Formation
Instead of continuing lower, ADA started doing something healthier: sideways movement, volatility contraction, repeated higher lows, and no new breakdown. This is often called an accumulation range. Price stayed roughly between $0.142 and $0.149. Volume isn’t shown, but price structure improved noticeably.
Phase 4 (Current): Breakout
Now we see consecutive green candles, a strong impulsive move, higher highs, and higher lows. Price has reached around $0.1645. This is the strongest momentum seen since mid-June.
 Source: CoinAnk
ADA Price Action Structure and Key Levels
The current ADA price structure has changed from bearish to early bullish. This is not yet a confirmed macro uptrend. It is the first serious bullish attempt after weeks of selling.
Support Zones:
- Strong Support: $0.138–$0.140 – This is the monthly low. Very important support. If this breaks, expect another bearish leg.
- Secondary Support: $0.145–$0.148 – Old consolidation. Current breakout originated here. Buyers should defend this area.
- Immediate Support: $0.159–$0.161 – Previous breakout level. If price retraces, this is where buyers should appear.
Resistance Zones:
- First Resistance: $0.166–$0.168 – Price is entering this area now. It previously acted as support during the downtrend and now becomes resistance.
- Major Resistance: $0.173–$0.176 – Multiple swing highs. Expect significant selling pressure.
- Heavy Resistance: $0.183–$0.190 – This was the June top. Breaking this would completely change market structure.
Cardano Technical Indicators: RSI, MACD, and CCI Analysis
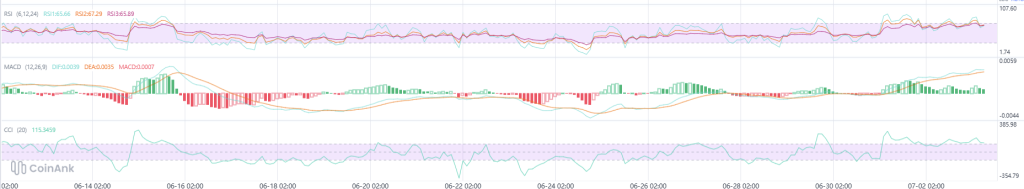
RSI (6,12,24): Visible values are RSI1 ≈64, RSI2 ≈66, RSI3 ≈65. This tells us bullish momentum is present, with ADA approaching overbought but not extremely overheated. Normally, below 30 is oversold and above 70 is overbought. ADA is sitting in the sweet spot where bulls usually remain in control. However, if RSI pushes above 70 while price reaches resistance, expect some profit taking.
MACD: Current MACD looks healthy. The MACD line is above the Signal line. The Histogram is positive and expanded nicely during the rally. The only thing to watch is that recent histogram bars are no longer expanding rapidly. That means momentum is still bullish, but acceleration is slowing. That often happens before consolidation, a small pullback, or continuation – not necessarily a reversal.
CCI: CCI ≈113, which is above +100 and means strong bullish momentum. CCI often cycles above +100 during strong trends, back toward 0 for cooling off, and below -100 for oversold conditions. Currently, buyers remain dominant.
 Source: CoinAnk
Does the ADA Chart Look “Dead”?
No. Actually, it looks more alive than it has for weeks.
Reasons:
- Broke out of a long consolidation
- Higher highs and higher lows
- Momentum indicators aligned
- No obvious bearish divergence yet
What it doesn’t have yet:
- Explosive trend
- Major volume confirmation
- Break above major resistance
I would describe it as a bullish recovery – not yet a full bull trend.
Cardano Price Prediction (Short-Term): Bullish and Bearish Scenarios
Bullish Scenario: If ADA holds above $0.160, the next targets become $0.167, then $0.172, and $0.176. If the crypto market remains strong, $0.18+ becomes realistic.
Bearish Scenario: If the current rally fails, watch $0.160, then $0.155, then $0.148. Loss of $0.148 would likely invalidate much of the recent bullish structure and raise the odds of revisiting the $0.140 area.
Cardano News Today
Cardano has integrated with institutional crypto platform Fireblocks. This provides asset managers, banks, and fintechs with secure, compliant infrastructure to custody, manage, and build on ADA and native tokens. This is a significant step toward institutional adoption, as Fireblocks is one of the leading custody and settlement platforms for traditional financial institutions.
On-Chain Voting and Governance
On-chain voting and Delegate Representatives (DReps) are live. ADA holders now have more power over decisions. But Charles Hoskinson argues that without a focused game plan, execution is becoming more complicated.
“The asks are paired with execution and one unified strategy to grow?” Hoskinson asked, pointing to what he views as the biggest challenge facing decentralized governance. His argument centers on the gap between community participation and delivering measurable outcomes that expand the network.
Hoskinson pointed to Cardano’s early days to make his case: “It used to be me, from 2017 to 2021, and we went from $0.04 to $3.00. There was delegated authority.” Back then, development ran under a more centralized leadership. And it worked – the ADA price climbed from pennies to an all-time high near $3.
FAQs

No. The chart shows a bullish recovery with higher highs, higher lows, and aligned momentum indicators. But it is not yet a confirmed macro uptrend.
First resistance is $0.166–$0.168, major resistance is $0.173–$0.176, and heavy resistance is $0.183–$0.190.
Subscribe to our YouTube channel for daily crypto updates, market insights, and expert analysis.
The post Will Cardano Ever Recover? ADA Price Chart Looks ‘Dead’, But… appeared first on CaptainAltcoin.


Ayrıca Şunları da Beğenebilirsiniz
Memory Price-Fixing Allegations Resurface as AI Boom Fuels DRAM Rally, Podcast Hosts Warn of Bubble Risks

Crypto Market Drops as Fear Grows and Major Assets Decline


