

Kava Price Prediction 2025, 2026 – 2030: Will KAVA Price Shoot To $1?
The post Kava Price Prediction 2025, 2026 – 2030: Will KAVA Price Shoot To $1? appeared first on Coinpedia Fintech News
Story Highlights
- The live price of Kava crypto is $ 0.04789091.
- In 2026, KAVA could attempt to recover toward the $0.35 zone.
- By 2030, KAVA may target the $5 level.
Kava Network positions itself as a hybrid Layer-1 blockchain combining the developer flexibility of Ethereum with the speed and interoperability of Cosmos.
Its unique co-chain architecture allows Ethereum Virtual Machine (EVM) compatibility alongside Cosmos SDK infrastructure, aiming to deliver high performance with low fees.
Now that the KAVA token is trading near $0.048, investors are questioning whether Kava can see a comeback in the next cycle. Here is CoinPedia’s Kava (KAVA) price prediction for 2026, 2027, and 2030.
Let’s find out.
Kava Price Today
| Cryptocurrency | Kava |
| Token | KAVA |
| Price | $0.0479 |
| Market Cap | $ 51,858,538.80 |
| 24h Volume | $ 2,576,733.8752 |
| Circulating Supply | 1,082,847,302.00 |
| Total Supply | 1,082,847,302.00 |
| All-Time High | $ 9.1926 on 09 September 2021 |
| All-Time Low | $ 0.0297 on 10 October 2025 |
Table of contents
- Kava (KAVA) Price Targets For March 2026
- Technical Analysis
- KAVA (KAVA) Price Prediction 2026
- Kava Price Targets 2026 – 2030
- KAVA Token Price Forecast 2026
- KAVA Crypto Price Projection 2027
- KAVA Coin Price Action 2028
- KAVA Token Price Analysis 2029
- KAVA Price Prediction 2030
- What Does The Market Say?
- CoinPedia’s KAVA Price Projection 2025
- FAQs
Kava (KAVA) Price Targets For March 2026
Historically, Kava was known for lending and stablecoin minting products within DeFi, but competition from larger ecosystems slowed its growth.
Perhaps March 2026 could be a stabilizing period for Kava as the market begins to look at undervalued Layer-1 projects.
KAVA serves as the settlement asset for AI compute costs, adding a new real-world demand layer beyond DeFi. With KAVA staked across the top 100 validator nodes under Proof-of-Stake, network security remains strong
If staking participation increases and ecosystem liquidity improves, KAVA price could pump to $0.0913.
Technical Analysis
On the 4-hour price chart, KAVA shows clear bearish momentum after breaking below its key support at $0.050.
Earlier, the price was moving inside a range between $0.049 support and $0.058 resistance, but the recent breakdown confirms that sellers are now in control.
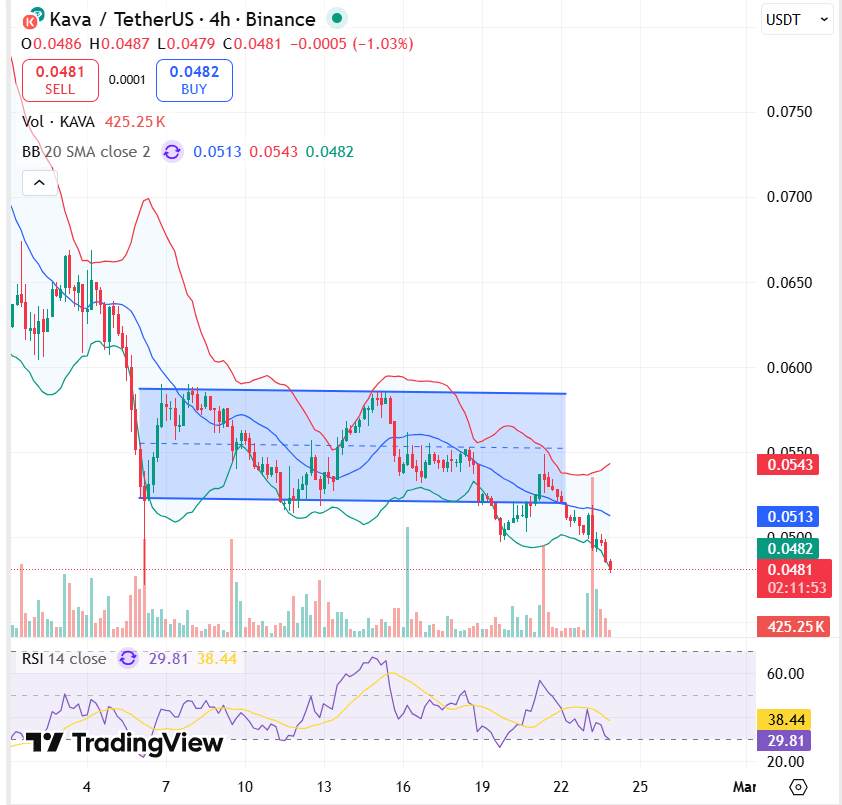
The price is trading below the Bollinger Bands midline (around $0.0513), which shows continued downward pressure. So, if the price continues falling, the next support is near $0.045.
On the upside, immediate resistance is at $0.0513, followed by the stronger resistance zone near $0.058. A move above this zone is needed to confirm trend reversal.
The RSI is near 30, which means the asset is close to the oversold zone.
| Month | Potential Low ($) | Potential Average ($) | Potential High ($) |
| KAVA Price Prediction March 2026 | $0.0371 | $0.0582 | $$0.0913 |
KAVA (KAVA) Price Prediction 2026
2026 could mark a structural shift for Kava, especially after the Kava 15 upgrade introduced a zero-inflation tokenomic model.
Unlike previous cycles, where new tokens were minted for rewards, the network now funds validator incentives entirely through transaction fees and the community pool. This significantly reduces long-term supply pressure.
Another major catalyst is Kava’s expansion into decentralized AI through its DeCloud infrastructure. The network now provides GPU resources for AI model training and on-chain inference.
If AI compute usage and DeFi TVL rise simultaneously, KAVA could approach the upper 2026 range
| Year | Potential Low ($) | Potential Average ($) | Potential High ($) |
| KAVA Price Prediction 2026 | $0.0054 | $0.1452 | $0.3401 |
Kava Price Targets 2026 – 2030
| Year | Potential Low ($) | Potential Average ($) | Potential High ($) |
| 2026 | $0.0054 | $0.1452 | $0.3401 |
| 2027 | $0.0474 | $0.3756 | $0.7146 |
| 2028 | $0.138 | $0.752 | $1.55 |
| 2029 | $0.540 | $1.19 | $2.36 |
| 2030 | $0.826 | $2.228 | $5.17 |
KAVA Token Price Forecast 2026
If DeFi liquidity returns and Kava’s co-chain model proves efficient, KAVA could approach $0.34
KAVA Crypto Price Projection 2027
By 2027, the impact of the $750 million Kava Rise incentive program could become more visible. KAVA could benefit from increased utility demand.
KAVA Coin Price Action 2028
As interoperability deepens between Ethereum, Cosmos, and BNB Smart Chain, Kava may strengthen its cross-chain position, pushing KAVA’s price to $1.55.
KAVA Token Price Analysis 2029
If DeCloud becomes a recognized decentralized alternative for AI compute and the zero-inflation model continues reducing sell pressure, KAVA could test $2.4.
KAVA Price Prediction 2030
By 2030, Kava’s valuation will depend on whether it becomes a dual-purpose chain, then the token could target the $5.17.
What Does The Market Say?
| Year | 2026 | 2027 | 2030 |
| Digitalcoinprice | $0.0511 | $0.11 | $0.17 |
| Tradersunion | $0.0177 | $0.0312 | $0.0547 |
| Coincodex | $0.05726 | $0.0568 | $0.2660 |
CoinPedia’s KAVA Price Projection 2025
From CoinPedia’s perspective, Kava represents a value-oriented Layer-1 project currently trading near long-term support. Its future depends heavily on whether DeFi adoption rebounds and whether its Ethereum–Cosmos co-chain model gains real traction.
If ecosystem liquidity increases and staking participation remains strong, KAVA could gradually reclaim the $0.34 level in 2026.
| Year | Potential Low ($) | Potential Average ($) | Potential High ($) |
| 2026 | $0.0054 | $0.1452 | $0.3401 |
Never Miss a Beat in the Crypto World!
Stay ahead with breaking news, expert analysis, and real-time updates on the latest trends in Bitcoin, altcoins, DeFi, NFTs, and more.
FAQs
In simple words, KAVA allows users to borrow, lend, and trade assets, as well as offers a wide range of financial services, including stablecoin issuance and earning interest.
Kava’s future depends on its unique “co-chain” interoperability, zero-inflation model, and expanding decentralized AI infrastructure.
KAVA could trade between $0.0054 and $0.34 in 2026, depending on DeFi growth, AI compute demand, and staking participation.
If adoption expands across DeFi, AI compute, and cross-chain use cases, KAVA could target multi-dollar levels by 2030.
KAVA’s long-term outlook depends on ecosystem growth, zero-inflation tokenomics, and real adoption. Investors should assess risk carefully.


Ayrıca Şunları da Beğenebilirsiniz

Troubling signs in new Trump intel report alarm expert: 'Raises real questions'

Top Analyst Uses Hydraulic Pipe Analogy to Project XRP Rally from Bitcoin Capital Rotation


