The post Is Solana Price Heading Toward $50 Support Levels? appeared first on Coinpedia Fintech News The Solana price is sending mixed signals because on one handThe post Is Solana Price Heading Toward $50 Support Levels? appeared first on Coinpedia Fintech News The Solana price is sending mixed signals because on one hand

Is Solana Price Heading Toward $50 Support Levels?

2026/03/28 22:17
Okuma süresi: 3 dk
Bu içerikle ilgili geri bildirim veya endişeleriniz için lütfen crypto.news@mexc.com üzerinden bizimle iletişime geçin.
Solana Ecosystem Step Finance Shuts Down after $29M Hack

The post Is Solana Price Heading Toward $50 Support Levels? appeared first on Coinpedia Fintech News

The Solana price is sending mixed signals because on one hand, the network is flexing serious dominance. On the other, the token itself? Not so much. It’s one of those classic crypto moments where fundamentals scream bullish, but price action quietly disagrees.

Let’s start with the headline stat. Solana has officially overtaken Ethereum in all-time unique developers. We’re talking 10,864 developers on Solana versus 9,017 on Ethereum, with Polkadot trailing at 8,995. That’s not a small gap in fact it’s a statement. The developer war, at least for now, has a new leader.

Solana Developer Growth Outpaces Ethereum And Polkadot Significantly

Developer activity is often the backbone of long-term ecosystem growth. More builders usually mean more apps, more usage, and eventually, more value.

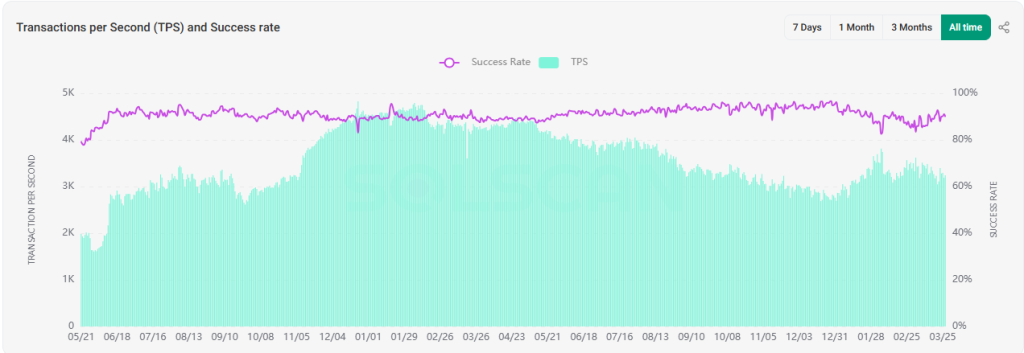
Add to that Solana’s claim of being one of the fastest networks, and surprisingly, the data backs it up. The chain is consistently maintaining over 3,000 transactions per second. That’s not theoretical throughput but it’s sustained activity.

Is Solana Price Heading Toward $50 Support Levels?

Solana Price Weakens Despite Strong Network Fundamentals Growth

Despite all this progress, the Solana price has been under pressure. And no, it’s not some hidden flaw in the tech. The likely culprit is broader market weakness, combined with geopolitical uncertainty that tends to spook risk assets across the board.

Then there’s the technical side of things. Solana’s rally above $250 earlier created what now looks like a textbook supply zone. Price has been rejected from that level not once, not twice, but three times. That’s not random that’s sellers defending territory.

Volume peaked during that move, and since then? It’s been cooling off hard.

Futures Volume Bubble Map Shows Cooling Demand Pressure

So, what’s actually happening under the hood? The futures volume bubble map paints a pretty clear picture. Demand isn’t just slowing but it’s fading. The aggressive buying that once pushed price higher has stepped back, leaving behind a market that’s trying to find balance.

Is Solana Price Heading Toward $50 Support Levels?

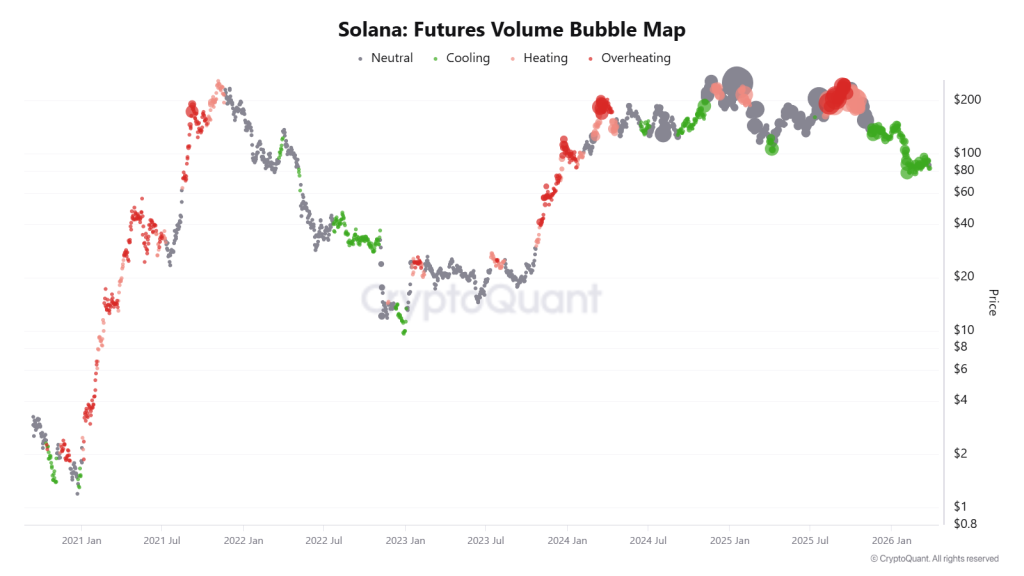
And right now, that balance looks lower. The cooldown phase is still in progress, and if this trend continues, the Solana price could extend its decline toward the $52–$58 range. That’s where a more meaningful bottom might form only if buyers decide to show up again.

Until then, it’s a bit of a paradox. A network leading in developers, maintaining high throughput, and expanding its ecosystem… while its token struggles to keep up.

That’s crypto for you. Fundamentals build the story but price writes the headline. And right now, the Solana price headline isn’t exactly bullish.

Piyasa Fırsatı
STAT Logosu
STAT Fiyatı(STAT)
$0,0259
$0,0259$0,0259
0,00%
USD
STAT (STAT) Canlı Fiyat Grafiği
Sorumluluk Reddi: Bu sitede yeniden yayınlanan makaleler, halka açık platformlardan alınmıştır ve yalnızca bilgilendirme amaçlıdır. MEXC'nin görüşlerini yansıtmayabilir. Tüm hakları telif sahiplerine aittir. Herhangi bir içeriğin üçüncü taraf haklarını ihlal ettiğini düşünüyorsanız, kaldırılması için lütfen crypto.news@mexc.com ile iletişime geçin. MEXC, içeriğin doğruluğu, eksiksizliği veya güncelliği konusunda hiçbir garanti vermez ve sağlanan bilgilere dayalı olarak alınan herhangi bir eylemden sorumlu değildir. İçerik, finansal, yasal veya diğer profesyonel tavsiye niteliğinde değildir ve MEXC tarafından bir tavsiye veya onay olarak değerlendirilmemelidir.

Ayrıca Şunları da Beğenebilirsiniz

Troubling signs in new Trump intel report alarm expert: 'Raises real questions'

Troubling signs in new Trump intel report alarm expert: 'Raises real questions'

A new intelligence report on Iran's military capabilities alarmed an expert during a CNN interview. CNN reported, citing sources inside the Trump administration
Paylaş
Rawstory2026/04/03 10:22
Top Analyst Uses Hydraulic Pipe Analogy to Project XRP Rally from Bitcoin Capital Rotation

Top Analyst Uses Hydraulic Pipe Analogy to Project XRP Rally from Bitcoin Capital Rotation

The post Top Analyst Uses Hydraulic Pipe Analogy to Project XRP Rally from Bitcoin Capital Rotation appeared on BitcoinEthereumNews.com. Marketing analyst compares Bitcoin to wide pipe and XRP to narrow pipe system Theory suggests 5% Bitcoin capital rotation could generate $115 billion XRP inflow Projected targets range from $6-15 for slow flows to $15-60 for rapid movements Marketing research analyst Dr. Jim Willie has presented a hydraulic pipe analogy to explain how capital flowing from Bitcoin into XRP could trigger explosive price movements. During an appearance on Black Swan Capitalist with host Versan Aljarrah, Willie used physics principles to illustrate potential market dynamics between the two cryptocurrencies. Willie compared Bitcoin’s large market capitalization to a wide hydraulic pipe and XRP’s smaller market to a much narrower tube. His theory suggests that when pressure transfers from larger to smaller pipes, force increases substantially because area scales with the square of radius measurements. Market Cap Ratios Drive Theoretical Price Impact The analyst established a framework where Bitcoin’s market capitalization equals approximately 13 times XRP’s valuation, creating a mathematical basis for his projections. Under this model, identical capital flows that barely affect Bitcoin’s price could generate 13 times greater impact on XRP due to liquidity depth differences. Willie noted that real trading environments create non-linear effects as order books thin during large transactions, spreads widen, and liquidity providers withdraw. In smaller markets like XRP, price movements can follow quadratic rather than linear patterns, potentially amplifying the 13-fold liquidity gap into price swings tens or hundreds of times more extreme than Bitcoin. The analyst outlined different scenarios based on rotation speed. Slow transitions over weeks would allow market makers time to adjust, potentially driving XRP 2-5x higher while Bitcoin declines orderly. Daily timeframes could produce 5-20x XRP gains with sharper Bitcoin drops, while hourly rotations might create vertical XRP spikes of 10-20x before rapid corrections. Willie identified several amplifying factors including XRP’s limited…
Paylaş
BitcoinEthereumNews2025/09/23 06:20
Globalstar (GSAT) Stock Surges 15% on Amazon Acquisition Report

Globalstar (GSAT) Stock Surges 15% on Amazon Acquisition Report

TLDR Globalstar stock jumped more than 15% in after-hours trading following a Financial Times report that Amazon is in talks to acquire the satellite communications
Paylaş
Coincentral2026/04/02 19:49

Trade GOLD, Share 1,000,000 USDT

Trade GOLD, Share 1,000,000 USDTTrade GOLD, Share 1,000,000 USDT

0 fees, up to 1,000x leverage, deep liquidity