

Solana (SOL) Price: Bulls Have a Simple Mission — Flip $78 or Risk a Much Deeper Drop
TLDR
- SOL is trading near $68–$69 after a 5–7% drop in 24 hours, sitting close to key support
- The $75–$78 zone is the critical resistance bulls must reclaim to avoid further selling
- A whale opened a 20x short on 554,680 SOL (~$38 million) near $69, adding bearish pressure
- If $60 support breaks, analysts see risk of a deeper move toward the $40–$30 range
- The MACD histogram is showing early signs of slowing downside momentum near current levels
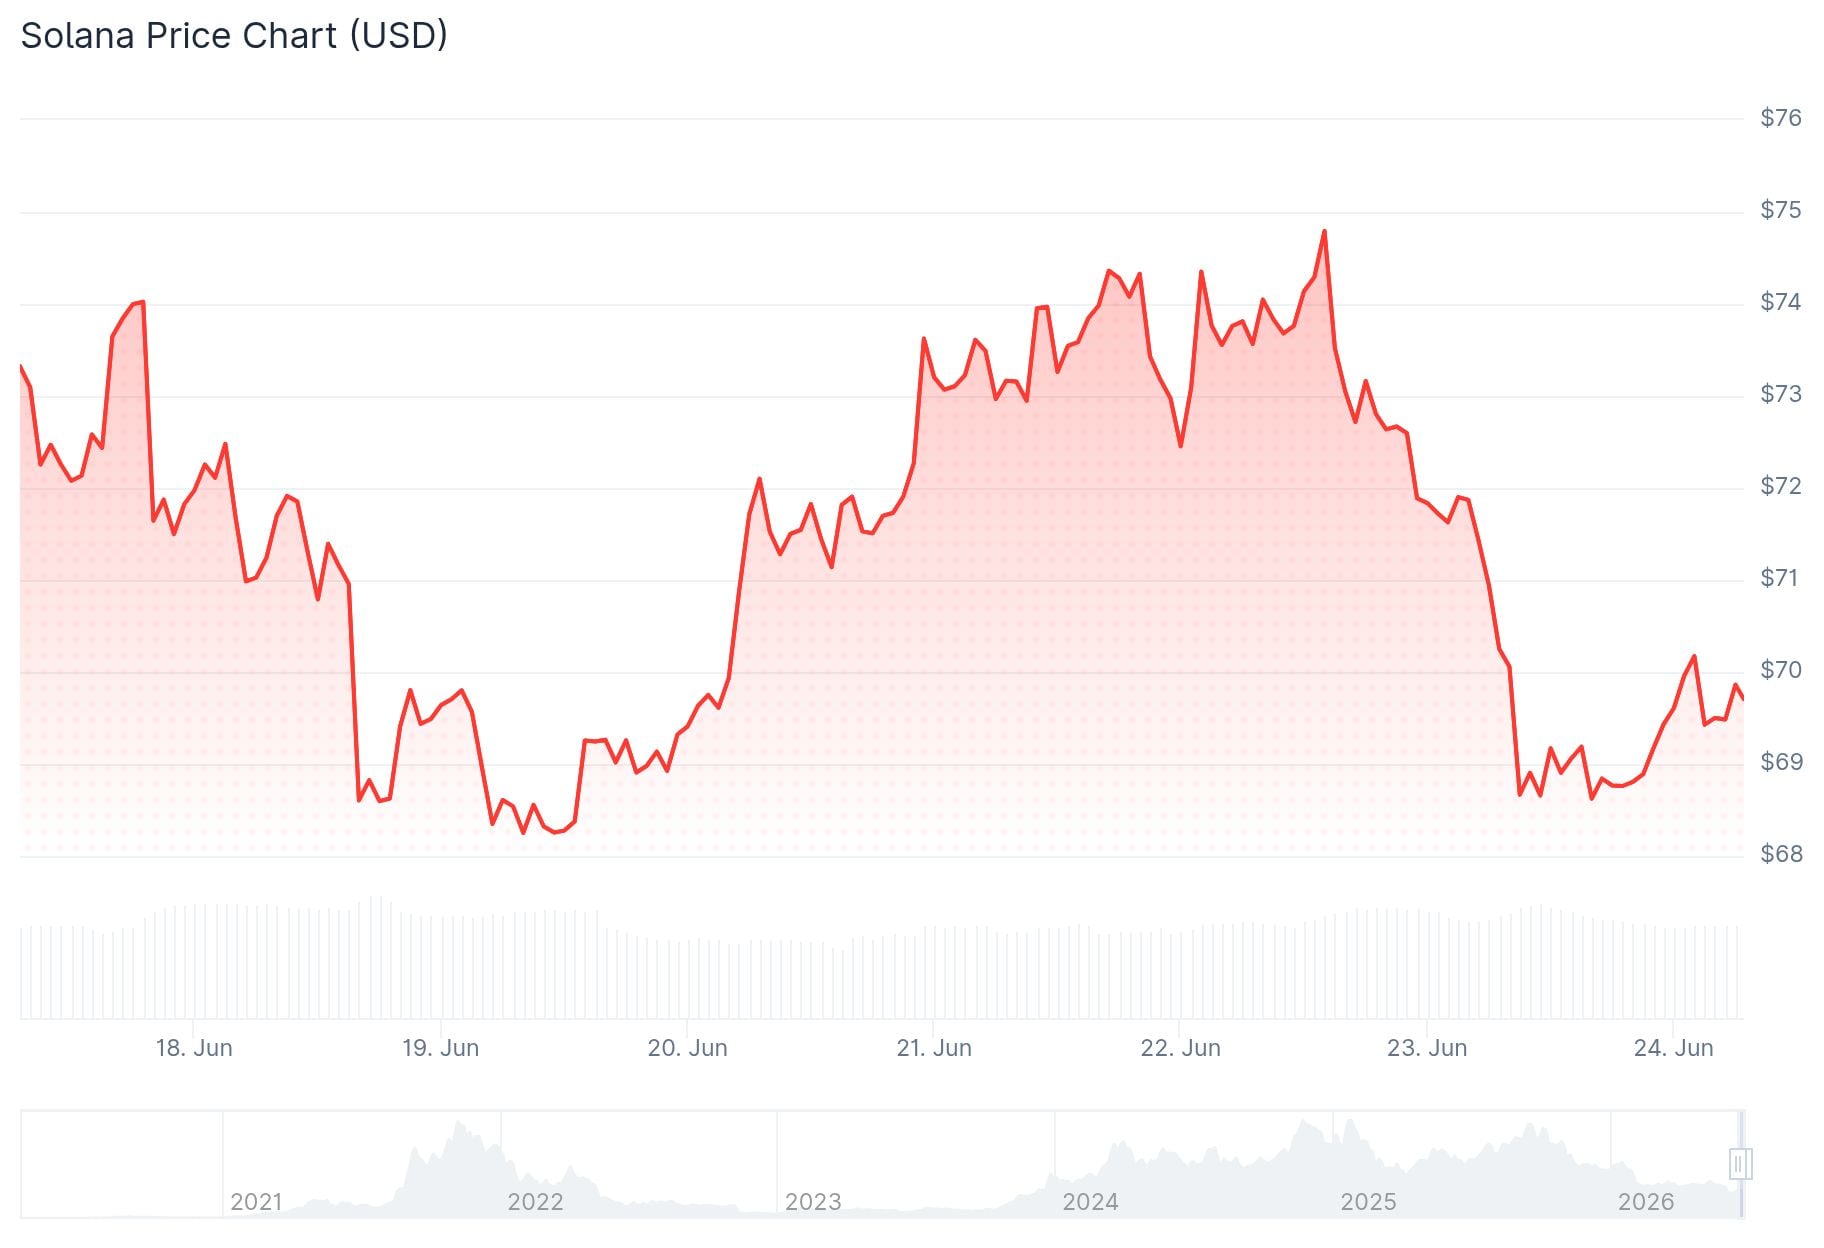
Solana has dropped sharply over the last 24 hours, falling more than 5% to trade around $68–$69. The price is sitting near its daily lows, with sellers in control of the short-term trend.
 Solana (SOL) Price
At the time of writing, SOL has a 24-hour trading volume of around $5.07 billion and a market cap of roughly $39.92 billion. The intraday range has been $68.41 on the low end and $72.80 on the high end.
The price briefly recovered earlier in the session but failed to hold above $70, pushing it back toward the lower end of the day’s range.
Whale Opens Massive Short Near $69
On-chain analytics platform Lookonchain reported that a whale opened a 20x leveraged short position on 554,680 SOL, worth approximately $38.15 million. The entry point was near $69.23, with a breakeven around $69.19.
With SOL trading at nearly the same level, this position is sitting close to profitability. As long as SOL stays below $69–$70, this short remains in the money and can weigh on market sentiment.
Crypto analyst Sjuul of AltCryptoGems noted on June 22 that sellers are still clearly in control on SOL, but buyers are locally trying to defend. He pointed out that flipping $78 is the key task for bulls, describing it as the trigger for a “power of 3” expansion setup — but warned traders to be careful with long positions until that level is reclaimed.
A reclaim of $70 and then $72 would begin to reduce that bearish pressure, but until that happens, the focus stays on the downside levels at $68, $64, and $60.
The $75–$78 Zone Is the Key Decision Area
The $75–$78 range is where analysts are focused. This zone has been highlighted as the “do-or-die” resistance area for Solana. If SOL breaks back above $78 and holds, the next targets are $85 and then the $90 region.
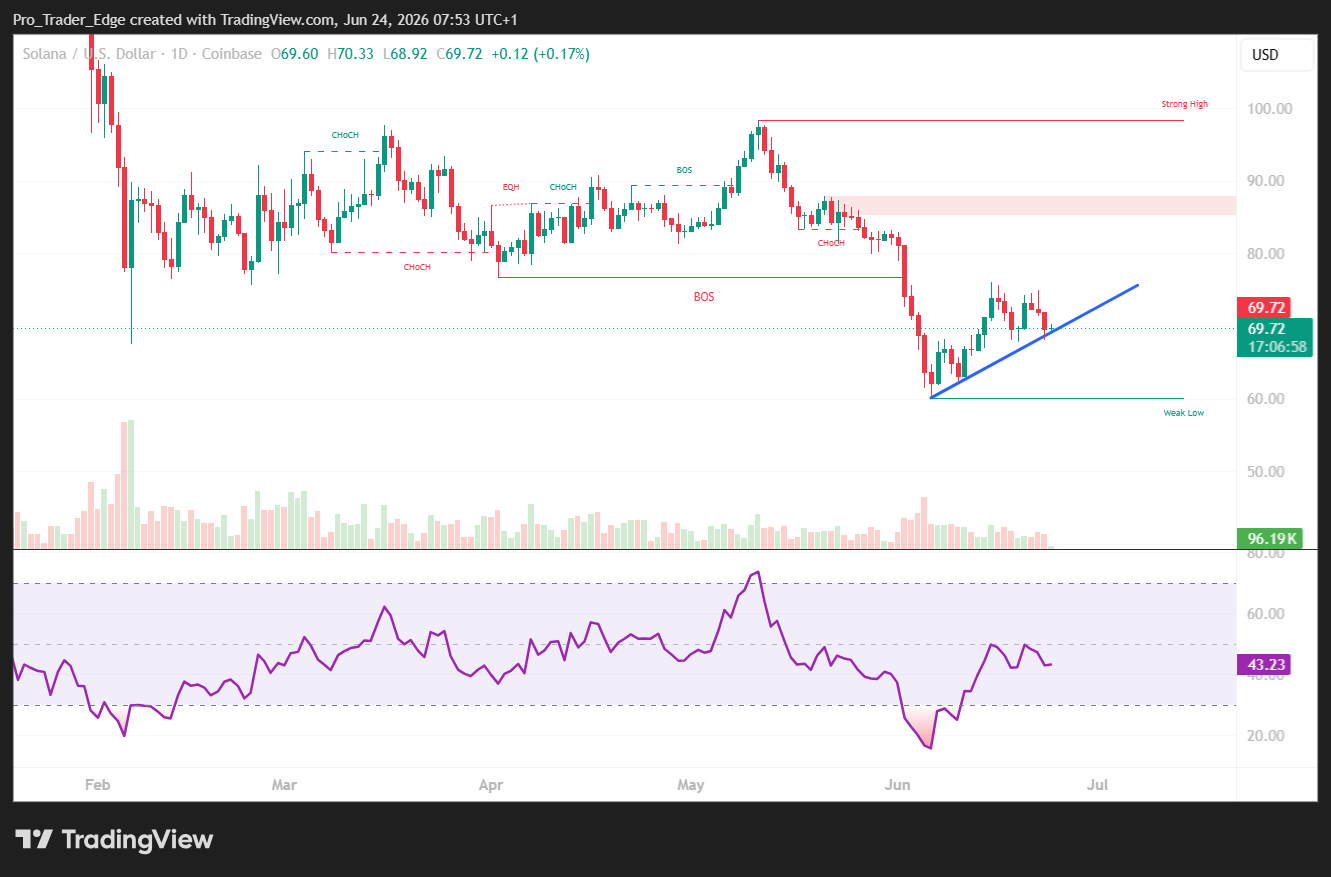 Source: TradingView
However, rejection from this zone would keep the bearish structure intact. A failure there could send the price back to $64–$60.
If $60 breaks, longer-term cycle analysis points to a support zone between $55 and $40 as the next area where buyers might try to build a base.
On the technical side, the MACD line sits at -1.81 against a signal line of -2.59, with a histogram reading of +0.79. This suggests the pace of selling may be slowing, but a confirmed recovery would need a break back above the mid Bollinger Band near $68.72.
The upper Bollinger Band sits at $75.69, which aligns with the resistance zone analysts have flagged.
Solana has been in a weak trend structure since October 2025, and the price remains below the broader $80–$90 reclaim zone that would need to break for a healthier trend to develop. The most recent data shows SOL trading near $69, just below the $70 level bulls need to reclaim as a first step.
The post Solana (SOL) Price: Bulls Have a Simple Mission — Flip $78 or Risk a Much Deeper Drop appeared first on CoinCentral.


You May Also Like
Bitcoin Price Analysis Shows Scaramucci Calling a Q4 Rally While Pepeto Could Be the Next Dogecoin

World Cup 2026: Over 336 fake websites emerge as scammers target football fans

RM1.7b NPE 2 to feature barrier-free MLFF toll system to ease Klang Valley congestion


