XRP ETFs See Biggest Outflows to Date as Ripple Price Dumps Again
The early 2026 gains were quickly erased from the markets due to escalating geopolitical tension that has harmed crypto more than any other financial field.
Investors have started to walk away from the industry, which is evident from the ETF flows in the US on Tuesday, which was the first business day for the week.
Ripple ETFs Turn Red
Recall that the first XRP-focused ETF with 100% exposure to the asset launched just over two months ago, followed by four more by the end of the year. The demand was substantial, as Canary Capital’s XRPC set a record for the highest trading volume on its debut day in 2025. The inflows were constant, and there was not a single day in the red until January 7.
Although the XRP ETFs bled out over $40 million then, the green streak returned, and they marked only net inflows from January 8 to January 16. However, that changed yesterday when the markets opened in the US for the first time since the geopolitical tension between the US and the EU had escalated over the weekend.
Data from SoSoValue shows that investors pulled out $53.32 million from the funds on what became their worst trading day, with the largest net outflow. The cumulative net inflows dropped from $1.28 billion to $1.22 billion in just one session, erasing almost all the funds attracted in the entire previous business week.
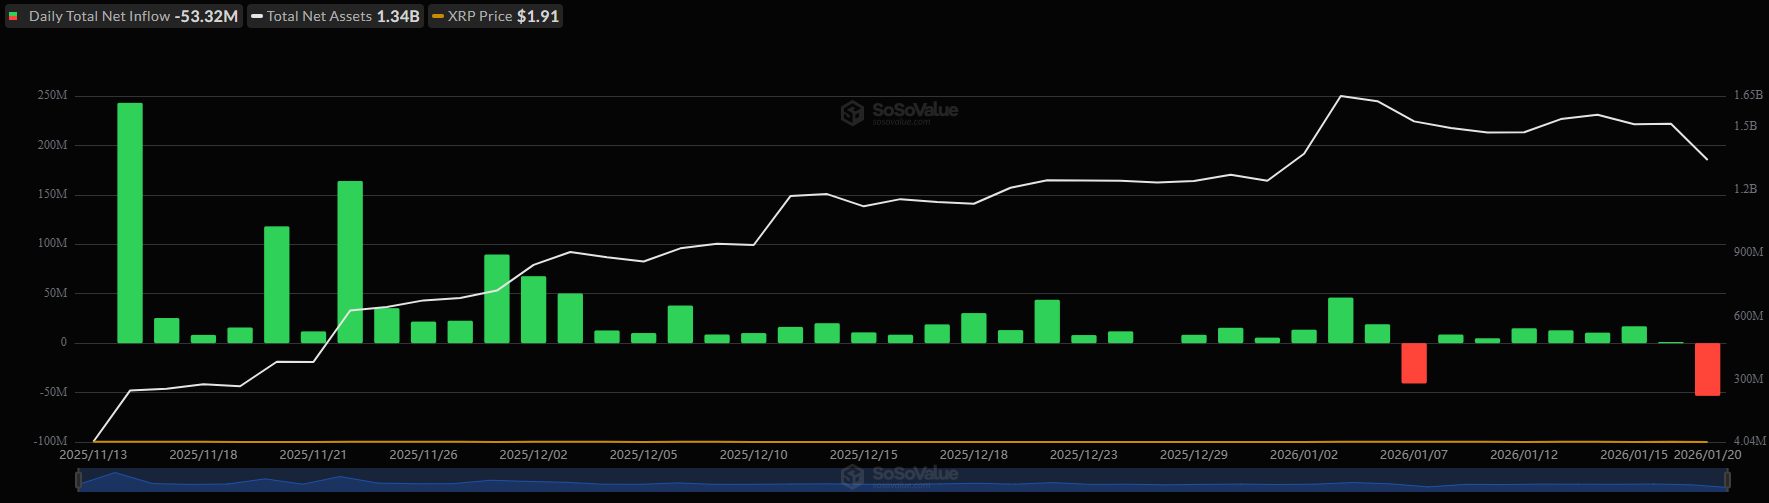 XRP ETF Flows. Source: SoSoValue
XRP Tumbles
The aforementioned outflows have only exacerbated XRP’s bearish trend lately. The asset flew to a multi-month peak of just over $2.40 on January 6, gaining roughly 30% in days. However, it has been mostly downhill since then, as it lost the $2.00 support on Monday morning and even dipped to $1.84 on some exchanges.
It currently struggles to remain above $1.90 after it fell to $1.86 durng the midnight sell-off. CryptoWZRD highlighted the bearish closure, especially against BTC, and indicated that the market leader “will be in charge.”
The post XRP ETFs See Biggest Outflows to Date as Ripple Price Dumps Again appeared first on CryptoPotato.
You May Also Like

Microsoft Corp. $MSFT blue box area offers a buying opportunity

Academic Publishing and Fairness: A Game-Theoretic Model of Peer-Review Bias